

Preview
Faculty Mentor
Christopher Badurek
Creation Date
4-2024
Description
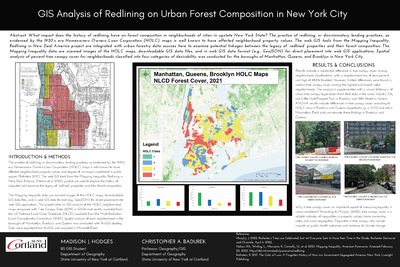
What impact does the history of redlining have on forest composition in neighborhoods of cities in upstate New York State? The practice of redlining, or discriminatory lending practices, as evidenced by the 1930’s era Homeowners Owners Loan Corporation (HOLC) maps is well known to have affected neighborhood property values. The web GIS tools from the Mapping Inequality: Redlining in New Deal America project are integrated with urban forestry data sources here to examine potential linkages between the legacy of ‘redlined’ properties and their forest composition. The Mapping Inequality data are scanned images of the HOLC maps, downloadable GIS data files, and in web GIS data format (e.g., GeoJSON) for direct placement into web GIS applications. Spatial analysis of percent tree canopy cover for fifty three neighborhoods classified into four categories of desirability was conducted in New York City. Results indicate a substantial difference in tree canopy cover among neighborhood classifications, with a neighborhood low of zero percent and high of 68.8% forested. However, limited differences were found in median tree canopy cover among the highest and lowest rated neighborhoods. The analysis is supplemented with a ‘visual dictionary’ of urban tree canopy types taken from field data in the areas Industry City and Little Haiti/Prospect Park in Brooklyn and 116th Street in Harlem. This project adds additional insight into the value of urban tree canopy cover as an indicator of inequalities in property values, home ownership rates, and in resilience to climate change.
Keywords
Redlining, New York City, Racial Justice, Mapping, Sustainability, Discrimination, Urban Forest